
Falling oil prices won't fix working capital pressure.
Brent is forecast to ease by late 2026, but the four shocks (supply, logistics, inflation, rates) each unwind on a different timeline.
When fuel doubles: oil's compounding shock through tourism and its suppliers
Brent crude has been swinging between $70 and $100 a barrel through June 2026 and jet fuel has roughly doubled since February 2026. Institutional forecasts have prices moderating by late 2026, with a market surplus in 2027. Between now and then, CFOs financing aviation, tourism, and the suppliers around both face higher freight costs, slower receivables, and a rate environment that has shifted under their existing facilities.
The compounding sequence
Crude prices have moved sharply against the forecasts that defined 2025. Treasurers and CFOs financing aviation, hospitality goods, specialty consumer products, and the supply chains around them are now working with assumptions set in late 2025 that no longer hold.
In October 2025, the World Bank's Commodity Markets Outlook projected Brent averaging $68 per barrel in 2025 and around $60 in a 2026 oversupply scenario. The US Energy Information Administration confirmed crude prices fell through 2025 as OPEC+ production target increases raised the prospect of a structurally loose market.
In June 2026, Brent has been swinging between roughly $70 and $100 per barrel depending on the day, with volatility tied to corridor flow conditions and ceasefire signalling. That is well above the sub-$65 levels seen in mid-2025. The IMF's April 2026 World Economic Outlook, written before the most acute phase of the corridor disruption, had already built in a 19 percent average energy price increase for 2026 relative to 2025, assuming a petroleum spot price near $82. June spot levels have spent most of the month above that assumption.
Mid-market exporters now face four shocks at once: supply, logistics, inflation, and rates. The combined effect is higher costs and tighter credit.
How this article reads the shock
The four layers
Click each layer to see the specific data and the timing for relief.
Supply: a small output increase against a large deficit
OPEC+ has been the central actor in managing the supply side. On May 1, 2026, the United Arab Emirates formally departed from OPEC and the broader OPEC+ alliance. Two days later, seven members of the OPEC+ voluntary-cuts subgroup agreed to a collective 188,000 barrels per day output adjustment from June, with Saudi Arabia and Russia each accounting for approximately 62,000 barrels per day. The increase is real and modest against the scale of the disruption.
Logistics: war-risk premiums set the timing
Maritime security sources estimate that physical mine-clearing and the establishment of verified safe transit protocols require a minimum of 40 to 50 days from any formal access agreement. War-risk insurance premiums are currently running between 1 and 4 percent of vessel value per transit. Shipowners require verified safe transit before committing capacity. Insurance pricing will follow verification, not the access agreement.
Inflation: oil is delaying rate cuts
The energy shock is operating as a classic supply shock: raising costs, compressing real incomes, dampening both consumption and investment. The Bank for International Settlements' March 2026 Quarterly Review documented how the disruption pushed up inflation expectations and led markets to price in a later start to rate cuts in major advanced economies. The IMF's April 2026 adverse scenario was explicit on the size of the downside.
Rates: facilities priced for cuts now face hold-or-higher
Trade finance facilities priced against an expected rate-cut cycle in late 2025 are now marked against a hold-or-higher environment. The cost of financing the same volume of goods has risen, not because credit risk has been repriced, but because the benchmark has shifted. That is a working capital cost that does not appear in the freight invoice.
Aviation absorbs first

Jet fuel is the most direct passthrough. IATA's June 2026 Global Outlook for Air Transport reported that jet fuel prices roughly doubled from late February 2026 levels, with refinery crack spreads in Northwest Europe at multi-year highs in April. The airline industry's response has been compressed margins and partial fare passthrough.
Forecast airline net margins for 2026 sit at 2 percent, a level last reached during the pandemic period. IATA projects passenger ticket yields will grow approximately 7 percent in 2026 as carriers attempt to recover fuel costs. A 7 percent yield gain does not offset a roughly 100 percent fuel cost increase; airlines absorb the difference in margin.
Brent crude: the eighteen-month reversal
From late-2025 projections of structural oversupply to a June 2026 spot swinging between $70 and $100, with institutional forward views landing in the mid-$80s by Q4 and into 2027.
Sources: World Bank Commodity Markets Outlook (October 2025 and April 2026), IMF World Economic Outlook (April 2026), IEA Oil Market Report (June 2026), EIA Short-Term Energy Outlook (June 2026). Spot figure represents June 2026 quotation referenced in IEA OMR.
How the shock reaches tourism

Higher airfares change tourism demand. The approximately 7 percent ticket yield increase pushes consumers toward shorter-haul routes, where fuel surcharges are a smaller share of total trip cost. Long-haul leisure routes, particularly transoceanic ones, are seeing the biggest volume declines.
Mid-market exporters in sectors adjacent to tourism (food and beverage, hospitality equipment, specialty consumer goods, in-flight catering supply chains) see the impact early. Order book visibility on tourism-exposed product lines is shortening. Receivables on the same lines are aging.
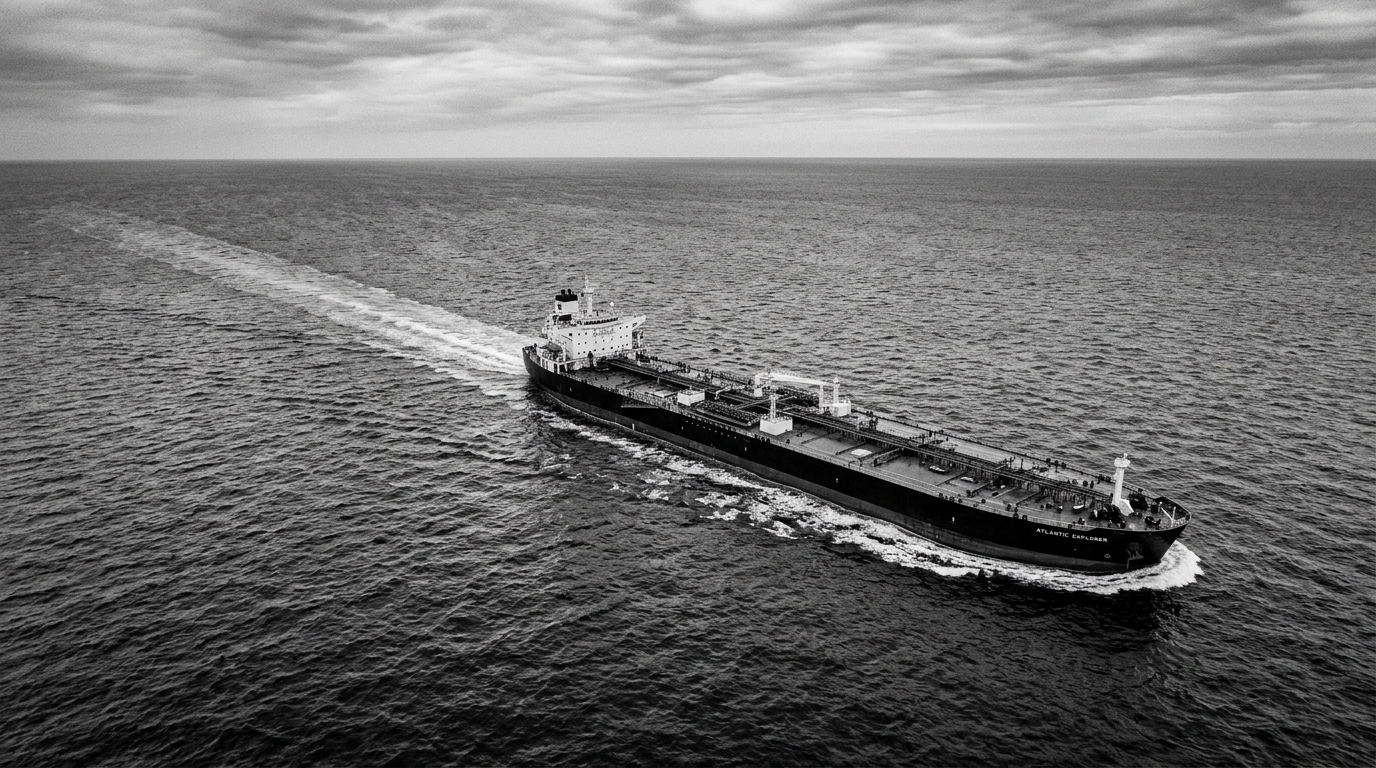
Manufacturing and industrial transport carry the same energy cost through a different channel. Elevated bunker costs are embedding in ocean freight rates, raising the cost of moving goods regardless of the product. Every freight invoice in mid-2026 includes a portion of the oil shock.
The corridor and the insurance market

Corridor logistics set the timing for everything else. Maritime security sources estimate a minimum of 40 to 50 days for physical mine-clearing and the establishment of verified safe transit protocols, measured from any formal access agreement. War-risk insurance premiums, currently running between 1 and 4 percent of vessel value per transit, will not move until independent observers confirm route safety.
A standard cargo vessel valued at $200 million, transiting at a 4 percent war-risk premium, carries an $8 million insurance cost per crossing. That cost is paid before the cargo earns anything. Access agreements do not reduce it; only verified safe transit does.
War-risk premium calculator
Move the sliders to see how vessel value and premium percent set the per-crossing insurance cost.
Default settings reflect the source-reported standard case: a $200 million cargo vessel at the upper end of the current 1-4% premium range.
Spot freight indices have begun moderating. Trade credit facility pricing has not. The gap is appearing in receivables aging and in the tenor requests arriving at trade finance desks.
What happens next
The EIA projects Brent near $89 per barrel by the fourth quarter of 2026. The World Bank's April Commodity Markets Outlook had a 2026 full-year average around $86. The IEA expects a market surplus in 2027 as trade flows normalize and delayed upstream investments come online.
For CFOs and treasurers in tourism, aviation, and adjacent supply chains, the practical question is whether facilities sized in 2025 still fit 2026 working capital needs. Spot freight has begun moderating, but facility pricing benchmarks have not yet repriced. Receivables on tourism-exposed lines are aging now.
Falling oil prices alone will not resolve the working capital pressure. The four shocks unwind at different speeds, and that mismatch will persist through 2026.
Counterparty risk has tightened in parallel. Allianz Trade projects global insolvencies to rise approximately 6 percent in 2026, and credit insurers are watching payment delays in energy-intensive sectors.
For questions on how these shifts affect existing or planned trade finance exposures, contact the Ossiano Research Desk.
Sources used in this report.
- World Bank, Commodity Markets Outlook, October 2025. Source of the pre-shock baseline forecast (Brent $68 average for 2025, around $60 in the 2026 oversupply scenario) used to establish what 2026 assumptions looked like before the corridor disruption. openknowledge.worldbank.org
- US Energy Information Administration, Crude oil prices fell in 2025 amid oversupply. Confirmation that crude prices fell through 2025 as OPEC+ production target increases raised the prospect of a structurally loose market. eia.gov/todayinenergy
- World Bank, The Commodity Markets Outlook in Eight Charts, April 2026. Source of the World Bank's 2026 full-year Brent average estimate (around $86 per barrel) cited in the forward path. blogs.worldbank.org
- US Energy Information Administration, Short-Term Energy Outlook: Global oil markets, June 2026. Source of the EIA Q4 2026 Brent projection (~$89 per barrel) used in the closing forward path. eia.gov/outlooks/steo
- IEA, Oil Market Report, June 2026. Source of the 2026 supply and demand figures (102.4 mb/d supply, demand declining 1.1 mb/d year-on-year), the 3.9 mb/d annual supply decline, the OPEC+ output adjustment (188 kb/d collective from the voluntary-cuts subgroup, June), and the 2027 surplus expectation. iea.org/reports/oil-market-report-june-2026
- IEA, World Energy Investment 2026. Source of the under-$500 billion upstream oil investment figure cited in the Supply layer (third consecutive year below the threshold). iea.org/reports/world-energy-investment-2026
- IMF, World Economic Outlook, April 2026, Chapter 1. Source of the 19 percent 2026 average energy commodities price increase assumption (reference scenario), the $82 spot price assumption underlying that projection, and the adverse scenario (global growth to around 2.5 percent and inflation above 5 percent if energy supply disruptions persist). imf.org/WEO April 2026
- Bank for International Settlements, BIS Quarterly Review, March 2026. Source of the rate-channel analysis: how rising oil prices linked to the corridor disruption lifted transport costs and headline inflation, contributing to markets pricing in later rate cuts in major advanced economies. bis.org/qtrpdf
- Bank for International Settlements, Opening Remarks: Media Engagement, June 2026. Used as a supporting source for the central-bank-posture narrative in the Inflation and Rates layers. bis.org/review
- IATA, Global Outlook for Air Transport: Energy in Crisis, June 2026. Source of the sectoral passthrough data: jet fuel prices roughly doubled from late February 2026 levels, the 2 percent forecast airline net margin for 2026 (a pandemic-era level), and the approximately 7 percent projected passenger ticket yield growth as carriers attempt to recover fuel costs. iata.org/economic-reports
- Allianz Trade, Global Insolvency Outlook: Brace for the Middle East spillovers, April 2026. Source of the +6 percent projected rise in global insolvencies in 2026 cited in the closing counterparty-risk note. The forecast was revised upward from the firm's earlier baseline to reflect the corridor disruption's spillover effects on energy markets, shipping, and supply chains. allianz-trade.com/global-insolvency-report-2026
- S&P Global Ratings. Referenced as a supporting source on rated corporate credit quality, default activity, and rating transition research underlying the broader counterparty-risk environment discussed in the closing summary. The +6 percent 2026 insolvency forecast cited in this report is from Allianz Trade; S&P Global Ratings is referenced as a complementary source on credit conditions across rated corporates. spglobal.com/ratings
- The National News, OPEC+ producers agree to raise output from June, May 2026. Source for the OPEC+ output adjustment detail: seven members of the voluntary-cuts subgroup agreed to a collective 188,000 barrels per day adjustment from June, with Saudi Arabia and Russia each accounting for approximately 62,000 barrels per day. thenationalnews.com
All figures cited in this report are drawn from the named institutional sources at publication. Spot prices reflect data current to June 2026. Forward projections (Brent path, airfare increase, airline margin, insolvency rate) are the publishing institutions' own forecasts and are not endorsements by Ossiano Capital. This report does not constitute investment advice.
The real economy moves through Ossiano.